Utility Business Process And SAP Components

The primary service provided by a utility company is around Electricity, Natural Gas, Water and Waste management. In this blog series, I will primarily focus on Electric and Gas Utilities, however, many of the challenges and solutions discussed here are also common for Water and Waste Management processes. Experience shared in this blog is vastly with utility companies in the United States, so please consider it when reading this blog series as there are a some differences in the way utilities conduct business in United States and other countries.This is some what similar to derugulated market whihc is also availabe in most of the developing countries like India also
 
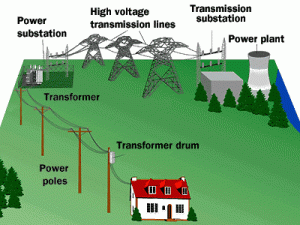
There are three main operating units in utilities namely, Generation, Transmission and Distribution. The generation arm is all about generating power from various sources like Coal, Natural gas, Solar, Nuclear etc. Once power is generated it needs to be transmitted through a network of grids and substations. This is usually dealt by the transmission business. From the substations, the power is then delivered to millions of homes and commercial establishments through the distribution arm of the business. The distribution business is closest to the customer and deals with many of the business processes that we will be dealing in this blog series.
A utility company implementing SAP usually deals with the following modules and SAP components
Plant Maintenance : There is a lot of infrastructure like Power stations, generators, reactors, transmission lines, meters, transformers etc. that require regular maintenance and repairs and all these are managed using the work management functionality provided by ECC IS-U
Project Systems: Most of the utility companies in the US are monopolies, so they are regulated as well. This means, among other things, the rate the utility charges its customers’ needs to be approved by regulators. This process is called ‘rate making’ or ‘rate case’ and as per regulations, utilities can only charge (in addition to the cost of commodities) the customers for any capital expenses incurred. For e.g., any improvements made to the existing infrastructure is treated as capital expense and can be included in the rate case whereas day to day cost of operations like fixing broken transmission lines or broken meters are considered operational expense and cannot be considered for rate case. Here is where Project systems (provided ECC IS-U) come in handy by allowing the various expenses incurred by the utility to be appropriately grouped in to Capital and Operational expenses.
Front Office: This module is mainly used by the distribution business. It primarily focuses on various customer service functions. Any interaction you do with the utility as a customer like moving in to a new house or moving out of your existing house, reporting outage etc. is enabled by the front office processes. The SAP components that are used here are SAP CRM and SAP ECC. Because it deals with customers and in many cases can deal with emergency situations, SAP implementations deal with complex configurations and enhancements in this area. Some of the key interfaces dealt in this area are integration with customer self-service web applications, CTI (Computer Telephony Integration), IVR (Interactive Voice Response) etc. Some of the key enhancements and developments dealt in this area are around CRM Interaction center, guided procedures and workflows.
Device Management: This module is also used by the distribution business. It deals with everything around managing and serializing meters, handling meter reads, consumption information and so on so forth. This module is all about device installation and maintenance. It also integrates with the quality control module for meter testing.
Billing: This module deals with all the configurations and processes around billing a customer for the services rendered. Billing is a complex process in utilities. One of the key inputs to the billing process is meter reads and when there are no meter reads for a particular month, usually there is an estimation process that estimates the customer’s bill based on the consumption history. Of course there are other line items and considerations in the bill, but you get the idea. Once the billing engine has determined the customer’s bill, we have to deal with bill printing which is usually a high volume activity. Usually, the actual bill print is done by 3rd party software and vendors, so SAP provides an integration format called RDI (Raw Data Interchange) which is a name value pair format. Many certified print vendors of SAP accept data in the RDI format.
Financials And Contract Accounting: Now that we have billed the customer, this module deals with payments received from the customer and any activities related to dunning and collections. Payments from the customer can come in through different channels like ACH payments, Credit cards, check etc., so SAP implementations deal with interfaces and print forms in this area.
These are the basic modules that SAP implementations in utilities deal with. Of course there other capabilities like AMI (Advance Metering Infrastructure), Analytics, Energy Data Management etc., but this blog is aimed at providing a high level overview of Utilities business process and the key SAP modules that support them.

SAP IS-Utilities for Generation and Transmission Business

SAP IS-Utilities (IS-U) is an integrated component on ECC stack and is a part of Industry Solutions offered by SAP.  IS-U has evolved to meet the unique needs of the Utility Industry, such as Electricity, Water, Gas, etc.  SAP IS-U product evolution is very much aligned with the utility industry market trends such us un-bundling of utility business, de-regulation and smart metering solutions.
 It has been observed that SAP IS-U is widely accepted in the Energy Retail space more than in Energy Generation and Transmission. There is a prevailing myth that SAP IS-U is only for the customer intensive Energy Retail Business … the reality is otherwise.
 The belief is that IS-U is meant for customer centric solutions handling customer-care and billing in the B to C scenario. But the reality is that IS-U gives flexibility in handle metering operations, generation and transmission billing solutions in the B to B scenario as well.  Some classic examples are Tata Power, India and National Grid Transco, UK who use SAP ISU for generation billing and transmission billing respectively.
 Even though the generation and transmission companies have fewer customers, the number of meters for individual customer in generation and transmission business is larger.  Handling large volumes of device attributes, meter readings, installation, removal, replacements, etc. are easy with SAP IS-U.  Since high voltages are involved, the metering infrastructure is mostly associated with Current Transformers (CTs) and Potential Transformers (PTs) for measurement purposes. The multiplication factors due to this CT and PTs are automatically taken into account while calculating consumption which eliminates both the need for manual calculations and development of separate programs for calculation. Also when the CTs and PTs are replaced by CTs and PTs of different ratios, the new ratios are automatically factored during calculations.
 
In the generation and transmission sector, the metering is spread across a large geographical area and it may involve complex calculations to arrive at the billing quantity. Additionally, the meters are mostly interval meters that necessitate handling of large volume of meter reading data. In certain cases, the interval data should also be used for billing computation. SAP IS-U is all the more appropriate in such cases as explained above.
As the generation and transmission utilities handle a large volume of energy there is a greater need for energy accounting. The transmission grid network can be mapped in SAP IS-U with network hierarchy which enables loss calculations. The Energy Data Management (EDM) component of SAP IS-U can be effectively used to mine and analyze historical data for reporting and forecasting.
Generation companies adhere to the schedule based on the frequency level of the grid given by the regulators to upload power in the grid. If the generation companies comply with the schedule and do not deviate from the limits they will be entitled to receive incentive from the regulator. Otherwise the generation companies will be penalized. Using the SAP ISU’s profile management parameters can be tracked and billings calculated which will be useful to verify the imbalance bills.
 SAP IS-U can be leveraged effectively to meet the needs of the Generation & Transmission segments of the Utility industry and its deployment need not be restricted only to the Energy Retail space.

SAP :Customer Segmentation in Smart Meter Analytics 1.0

Have you ever had a chance to see the Smart Meter Analytics (SMA) 1.0 features for customer segmentation? How would you use it in your Utility Company? What are some typical queries for finding customer groups you are interested in?

 First, you can use any of the master attributes to refine your target group. Here is the whole screen, master data attributes on the left, data visualization on the right. I know, hard to read … it gets better.
 
 You pick from the available attributes (which you can change in SMA). See how they already show you crucial information how many records they represent, and which power consumption … all calculated on-the-fly thanks to the power of HANA.
 

 As you select filter values you can check on the right hand side what impact that has on your data. Firstly, there is a chart showing you the distribution of
Selected master data attributes (again, you can of course customize these):
   

Then on the Time Series tab you can see a timeline of the power consumption for the selected customers. It is fun to slide the bluish bar at the bottom and extend and shrink the range, effortlessly zooming in and out of the data. There are also a few preset buttons below. The whole thing pretty much works like a stock ticker history gadget.

 
 Then on the next tab you can summarize the consumption by hour of the day or day of the week, by averages, totals, minimal or maximum power consumption.

 
 And by the way, on this and the previous tab you can compare what you have so far to other segments as well.

 
 The last tab really has one of the core pieces of SMA, the calculation of so-called pattern profiles. What SMA does when you load smart meter data is to run a nifty algorithm called “k-means clusters” to find out which daily consumption profiles look very similar and should be clustered. Imagine your typical profile as a residential customer. It will have a bump in the morning when everyone gets ready for school and work, then a lull, then another bump in the late afternoon and evening when the family cooks, watches TV, etc. SMA will find those daily patterns which look pretty similar and group them into one pattern profile. Now let’s say that many people also work from home twice a week. Your daily profile on those days will be quite different, as you use a computer, run the heating or aircon more intensively, etc. And a third profile may show when the family is on vacation: just a flat line close to zero, which only the fridge and freezer run.
 For your current segment SMA shows you which pattern profiles are exhibited in the data, and which are the more prominent ones in terms of overall power consumption and number of days when they showed up. This is an important criterion to select the right target group.


 As you filter the data for your desired customers the summary section shows you what you have selected to far, what power consumption this represents, and how many customers you ended up with.
 
 So far we have only filtered customers by their master data. But SMA also allows you to filter by their power consumption. Firstly, you can filter by the aforementioned pattern profiles.

 
 And secondly you can further refine this by how much power your customers will consume. Note that at the top you can also further select that you are only looking at a certain date range, or only certain days of the week.

 
 And then you are pretty much done! Save your new segment, and it will show up in the SMA dashboard, ready for you and colleagues you want to share it with. You could now export the selected customers and use them for a campaign in CRM, just share your insights into customer groups with colleagues, or look at the before and after situation when you have run say an energy efficiency campaign.

Business Integration

What is Vertical and Horizontal integration?

Many a times, while gazing through the business daily, you come across the words “Vertical integration” or “Horizontal integration”. While some take it as a business gimmick; others do have but only a slight idea of what it is. In any case, as a regular business reader or as an entrepreneur, one needs to be aware about all the aspects of vertical and horizontal integration.
Both of these relate to strategies that are made to grow your business but they differ in approach. And most of the times which one to choose is not a very straight forward decision.
In this post we will try to completely understand Vertical and Horizontal integration and list certain key things that a business should take care of while looking forward to any of these options
What is Vertical Integration?

Best one is from Investorwords which says.
Vertical integration is the process in which several steps in the production and/or distribution of a product or service are controlled by a single company or entity, in order to increase that company’s or entity’s power in the marketplace.
Simply said, every single product that you can think of has a big life cycle. While you might recognize the product with the Brand name printed on it, many companies are involved in developing that product. These companies are necessarily not part of the brand you see.
Example of vertical integration: while you are relaxing on the beach sipping chilled cold drink, the brand that you see on the bottle is the producer of the drink but not necessarily the maker of the bottles that carry these drinks. This task of creating bottles is outsourced to someone who can do it better and at a cheaper cost. But once the company achieves significant scale it might plan to produce the bottles itself as it might have its own advantages (discussed below). This is what we call vertical integration. The company tries to get more things under their reign to gain more control over the profits the product / service delivers.
Types of Vertical Integrations:

There are basically 3 classifications of Vertical Integration namely:
1.        Backward integration – The example discussed above where in the company tries to own an input product company. Like a car company owning a company which makes tires.
2.        Forward integration – Where the business tries to control the post production areas, namely the distribution network. Like a mobile company opening its own Mobile retail chain.
3.        Balanced integration – You guessed it right, a mix of the above two. A balanced strategy to take advantages of both the worlds.
What is Horizontal Integration?

Much more common and simpler than vertical integration, Horizontal integration (also known as lateral integration) simply means a strategy to increase your market share by taking over a similar company. This takes over / merger / buyout can be done in the same geography or probably in other countries to increase your reach.
Examples of Horizontal Integration are many and available in plenty. Especially in case of the technology industry, where mergers and acquisitions happen in order to increase the reach of an entity.
As per me an apt example of Horizontal Integration will be You Tube, which was taken over my Google primarily because it had a strong and loyal user base. (There was no rocket science in technology used at YouTube which Google couldn’t have done without taking over, but yes to increase the viewers was definitely as complex without the takeover.)
Executing these strategies and key points to remembers

Vertical and Horizontal integration strategy generally can be done by businesses which have established themselves and probably have a stable life as compared to ones which have to address risks on a regular basis. The immediate advantage of implementing them is to
1.        Have economies of scale
2.        Expand your knowledge and capabilities
3.        Increase market (and profits)
4.        Own the whole life cycle so that you can change it the way required
5.        Reduce competition (by merging with them rather than competing)
6.        Provide better services
7.        Many more (refer links below)
Example:

Before signing off would recommend reading vertical integration case study from Wikipedia which highlights how Reliance Industries worked on backward integration and from textiles they got into polyester and later into petrochemicals. This was a brilliant strategy executed by the them owner Dhirubhai.

Google brings voice navigation to India

The feature would allow travellers, whether they are driving or walking, to get directions to a place through turn-by-turn voice instructions.

Google on Tuesday launched its much awaited navigation service in India. The feature, available on Android phones and tablets for free, would allow travellers, whether they are driving or walking, to get directions to a place through turn-by-turn voice instructions.

While Navigation app was always a feature of Android phones in India, the service was not supported officially. It used to show just the route and lacked support for voice instructions. Currently, the Navigation feature is in beta and Google tells users to exercise caution while using it.
We tested the app as soon as it went live and found it to be very accurate. In case of any deviation by a user in the middle of the way, the app automatically reroutes the coordinates. There are various options. Users can select whether they want walking instructions or driving directions. They can add or remove layers to change view from basic to the one that is more detailed. They can also save routes.
Navigation, that uses GPS chips in a device, is one of the most popular features among smart phone and tablet users across the world. In India, however, only Nokia offered this service on its high-end phones for free. TomTom and MapMyIndia were among other companies that provided the navigation service through paid apps.
Several third-party apps like Waze, available on both iPhone and Android devices, offered the service for free though they were not as accurate as Nokia Maps or Google Navigation.
Given the importance of navigation and map related features, Google is quietly bolstering its offerings in India. Along with the navigation, it also offers basic map services and local, which is a kind of dynamic directory of notable places around a user.
Recently, the company brought Transit to several Indian cities. Transit, which uses the data supplied by public transport authorities like Delhi Metro, allows a user to get information on routes covered by public transport and the time at which buses or trains can be boarded. Transit is available in several areas of Mumbai, Bangalore, Chennai, Pune, Hyderabad, Kolkata and Ahmedabad.
The turn-by-turn navigation may help Android devices stay ahead of iPhone in India. Apple, which recently decided to not use Google Maps in its devices, would be using its own map service in iOS 6. However, building an efficient map service takes time, especially in a country like India where roads and routes are not as organized as they are in the US or European countries. Both Nokia and Google have spent years perfecting their map service in India and it may take a while before Apple could match them here.

Sending Pop-up Message In SAP

There is a very interesting function module, with the help of which you can send the pop up messages to the users/friends who are logged into the SAP system.
The interesting function module name is ‘TH_POPUP’.
For this you and your friend should be logged on into the SAP system and you must know the SAP user id of your friend to whom you are going to send the message.
Please go through this and enjoy chatting with your friends while working on SAP system.
STEPS :
1.     Go to transaction SE37 and enter the function module name TH_POPUP.

2.     Pass the client, user name and the message which you want to send and execute the function module.

Output :
The pop up will appear to the user/friend’s SAP system

Note – if user has logged on multiple systems then the message will be sent to multiple systems.

Creating your own Scribd RSS Feed

Step 1: http://www.scribd.com/feeds/user_rss/xxxxxxx

Step 2: we need to determine User id and replace it with xxxxx in the above mentioned link.

Step 3: Log in to your Scribd Account and view any of your document.

Step 4 : Open the Source Code page of that page from Internet explorer/Mozilla Firefox

Step 5: search for  spinet code section

script type=”text/javascript”>
    window[‘$rat’] = ratInit(
          [“http://rs1.scribd.com/”,”http://rs2.scribd.com/”,”http://rs3.scribd.com/”,”http://rs4.scribd.com/”,”http://rs5.scribd.com/”,”http://rs6.scribd.com/”,”http://rs7.scribd.com/”,”http://rs8.scribd.com/”%5D,
            {“user_id”:156281674,”doc_id”:null}, //<— user_id!
            false
    );


window['$rat'] = ratInit(
["http://rs1.scribd.com/","http://rs2.scribd.com/","http://rs3.scribd.com/","http://rs4.scribd.com/","http://rs5.scribd.com/","http://rs6.scribd.com/","http://rs7.scribd.com/","http://rs8.scribd.com/"],
{"user_id":156281674,"doc_id":null}, //<--- user_id!
false
);
 

window['$rat'] = ratInit(
["http://rs1.scribd.com/","http://rs2.scribd.com/","http://rs3.scribd.com/","http://rs4.scribd.com/","http://rs5.scribd.com/","http://rs6.scribd.com/","http://rs7.scribd.com/","http://rs8.scribd.com/"],
{"user_id":156281674,"doc_id":null}, //<--- user_id!
false
);
The highlight number would be your Scribd account number